![]()
This part is very interesting because it allows you to screen our universe looking for attractive investment ideas under your own criteria.
You can filter the universe using the different selection boxes.
Example 1:
You are looking for large cap companies active in major telecommunications, with attractive valuation, quoted in USD and with a dividend yield of at least 3%.
Then, you can select:
- In sector: Communications
- In industry: Major Telecommunications
- Sigma Fundamental Rating(SFR): if you want attractive and highly attractive stock, select >=4 (1=highly unattractive, 2=unattractive, 3=neutral, 4=attractive, 5=highly attractive on a risk return basis which means upside potential (%) divided by the 50days volatility of the stock)
- In dividend yield: select 3 if you want stock with a dividend yield of at least 3%
- In currency: select USD if you only want stock quoted in USD.
- In market cap: select >=10Bln if you want large cap companies (<4bln = Small Caps; 4 to 10bln = Mid Caps; >10bln = Large Caps)
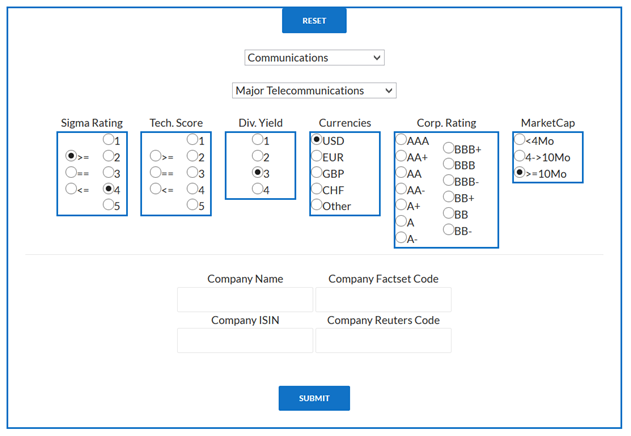
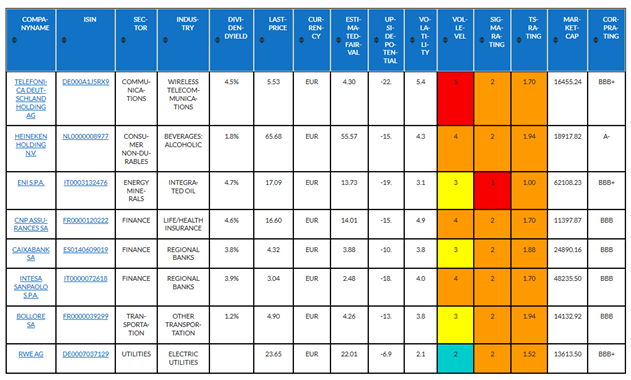
Then click submit and you get your result

Example 2:
You are convinced the market should decline due to very bad news in the euro zone and you are looking for unattractive stock quoted in euro (with a weak momentum) in order to short them. As you want to reduce the M&A risk (as a prey for your short), you are only looking for large cap companies (because when the company is very big, it is more difficult to buy it: Nobody could buy Apple or Exxon).
Then, you can select:
- Sigma Fundamental Rating (SFR): As you are looking for short ideas, you can select unattractive stock on a risk/return basis. So with Sigma Rating below or equal to 2
- Sigma Technical Score (STS): As you are looking for short idea, you are looking for stock with a weak technical score (weak trend and/or weak momentum). So, you can select STS below or equal to 2.
- Currency: As you are looking for EUR stocks, select “EUR” in currencies
- Market Cap: As you are looking for large cap stock, select “>=10bln” (<4bln = Small Caps; 4 to 10bln = Mid Caps; >10bln = Large Caps)
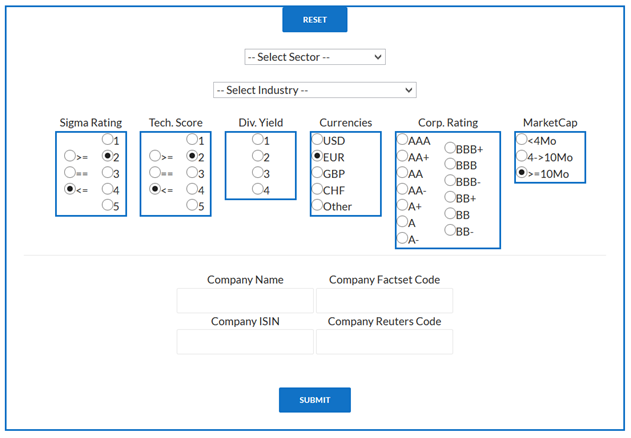
Then click submit and you get the result of your search
Explanations of our different parameters:
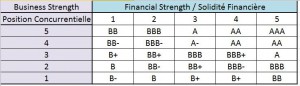
- The Sigma Corporate Rating (SCR) is a scoring scale we developed in order to attribute a corporate rating to each company. In order to do so, we analyse each company on two different aspects: their financial strength and their business strength. Based on different financial ratios and market data, we attribute a score from ‘1’ (weak) to ‘5’ (high) to the financial strength and the business strength. Thereafter, based on the matrix here below, we attribute the corporate rating.
- The Sigma Fundamental Rating (SFR) is a scoring scale we developed in order to make a link between the upside potential and the volatility level of a specific stock. So, a low volatility stock required less upside potential than a high volatility stock in order to justify a score of ‘4’ (attractive).
The scoring scale is determined as follow:
- SFR = ‘1’: the downside potential (based on our valuation models) is higher than -4 times the 50days price volatility expressed in percentage -> the stock is highly unattractive
- SFR = ’2’: the downside potential (based on our valuation models) is between -4 times and -2 times the 50days price volatility expressed in percentage -> the stock is unattractive
- SFR = ‘3’ : the estimated price change (based on our valuation models) is between -2 times and +2 times the 50days price volatility expressed in percentage -> the stock is neutral
- SFR = ‘4’ : the upside potential (based on our valuation models) is between +2 times and +4 times the 50days price volatility expressed in percentage -> the stock is attractive
- SFR = ‘5’ : the upside potential (based on our models) is greater than 4 times the 50days price volatility expressed in percentage -> the stock is highly attractive
- The Sigma Technical Score (STS) is a scoring scale we developed in order to score the trend and the momentum of a specific stock based on different time horizons (short term, medium term and long term).
The scoring scale is determined as follow:
- STS = ‘1’ : based on our algorithm dedicated to trend and momentum analysis, we consider the stock is highly unattractive
- STS = ‘2’ : based on our algorithm dedicated to trend and momentum analysis, we consider the stock is unattractive
- STS = ‘3’ : based on our algorithm dedicated to trend and momentum analysis, we consider the stock is neutral
- STS = ‘4’ : based on our algorithm dedicated to trend and momentum analysis, we consider the stock is attractive
- STS = ‘5’ : based on our algorithm dedicated to trend and momentum analysis, we consider the stock is highly attractive
- The Sigma Volatility Level (SVL) is a scoring scale we developed in order to estimate the volatility level of each stock within our investment universe.
- SVL = ‘1’ : the price volatility computed on the last 50 days is less than 50% of the average price volatility of our investment universe -> this stock was among the least volatile stock of our universe during the last 50 days.
- SVL = ‘2’ : the price volatility computed on the last 50 days is between 50% and 75% of the average price volatility of our investment universe -> this stock was less volatile than the rest of our investment universe.
- SVL = ‘3’ : the price volatility computed on the last 50 days is between 75% and 133% of the average price volatility of our investment universe -> this stock had a price volatility roughly in line with the price volatility of the rest of our universe.
- SVL = ‘4’ : the price volatility computed on the last 50 days is between 133% and 200% of the average price volatility of our investment universe -> this stock had a price volatility well above the average price volatility of the rest of our universe.
- SVL = ‘5’ : the price volatility computed on the last 50 days is greater than 2 times the average price volatility of our investment universe -> this stock was among the most volatile stock of our universe during the last 50 days.