![]()
We built an intraday model based on intraday fast momentum. The fast momentum is computed with the same formula than the 'normal' intraday momentum but we give more weight to recent data (and a lower weight to older data). So, this intraday fast momentum reacts more quickly to changes in trends.
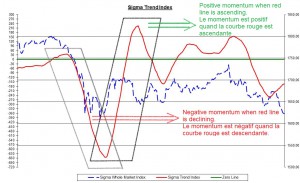
As we are focused on the change in the trend (the momentum), as long as the red line is ascending, we consider the momentum to be positive, and the intraday fast momentum model is in ‘buy’ mode.
At the opposite, when the red line is declining, we consider the momentum to be negative, and the intraday fast momentum model is in ‘sell’ mode.
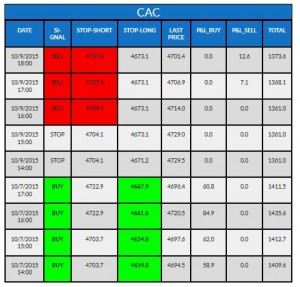
How can you read the tables?
Our quant models cover different European and US indexes. The name of the index concerned by the table is written on top of each table. In the following example, it is the 'CAC' (French index).
"Date" gives you the date and time when the model has been updated.
"Signal" gives you the positioning of the model when it was updated. This "signal" can either be "buy" (the model is long on this specific index), "sell" (the model is short on this specific index) or "stop" (the model has no position on this index).
"Stop-short" gives you the upper limit for the model to keep its short position. Above this level, the model will cut the position. (need a "sell" signal to be relevant)
"Stop-long" gives you the lower limit for the model to keep its long position. Below this level, the model will cut the position. (need a "buy" signal to be relevant).
"Last Price": value of the index at this time.
"P&L Buy": this column gives you the profit & loss result of each long position.
"P&L Sell": this column gives you the profit & loss of each short position.
"Total": this column gives you the total profit & loss of all positions generated by the model on this index during the last 6 months (trailing basis) for intraday models and the last 2 years (trailing basis) for daily models.