![]()
We built an intraday model based on intraday momentum. In this part, our Sigma Trend Index is computed on an hourly basis. Then we compute the 20 hours moving average of our Intraday Sigma Trend Index. It is plotted (in red) in the chart below.
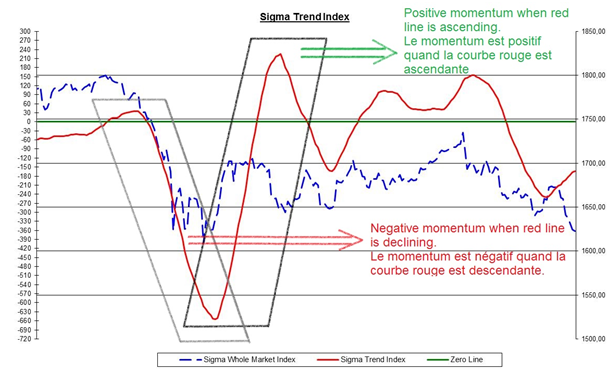
Nevertheless, in this part, we are not interested in the trend but we are focused on the change in the trend (the momentum). So, as long as the red line is ascending, we consider the momentum is positive, and the intraday momentum model is in ‘buy’ mode.
At the opposite, when the red line is declining, we consider the momentum is negative, and the intraday momentum model is in ‘sell’ mode.
What are the reasons to use two intraday models? Mainly because equity market is not always driven by the same parameters; sometimes it is driven by the momentum, sometimes by the trend, sometimes by a combination of both trend and momentum and sometimes by none of them (during high uncertainty).
So, using both a trend and a momentum based approach is useful because it allows investor to either focus on what is working on at current time or to simply diversify its risk by applying two complementary approaches.
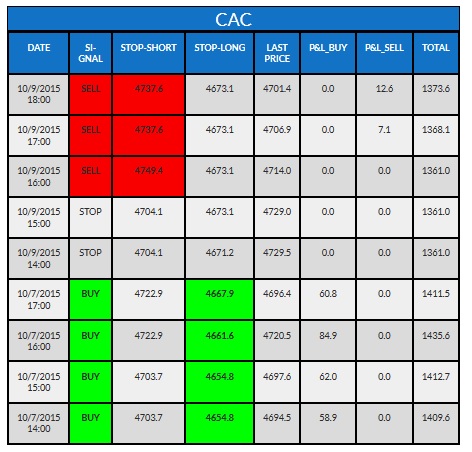
How can you read the tables?
Our quant models cover different European and US indexes. The name of the index concerned by the table is written on top of each table. In the following example, it is the 'CAC' (French index).
"Date" gives you the date and time when the model has been updated.
"Signal" gives you the positioning of the model when it was updated. This "signal" can either be "buy" (the model is long on this specific index), "sell" (the model is short on this specific index) or "stop" (the model has no position on this index).
"Stop-short" gives you the upper limit for the model to keep its short position. Above this level, the model will cut the position. (need a "sell" signal to be relevant)
"Stop-long" gives you the lower limit for the model to keep its long position. Below this level, the model will cut the position. (need a "buy" signal to be relevant).
"Last Price": value of the index at this time.
"P&L Buy": this column gives you the profit & loss result of each long position.
"P&L Sell": this column gives you the profit & loss of each short position.
"Total": this column gives you the total profit & loss of all positions generated by the model on this index during the 6 latest months (trailing basis) for intraday models and the 2 latest years (trailing basis) for daily models.