![]()
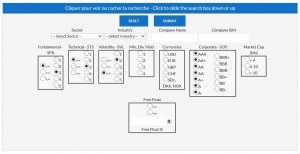
In this part, we screen our investment universe in order to detect the most defensive stocks, the stock we would like to have in portfolio when markets become more volatile. For sure, this is just a screening approach and it can’t avoid the specific risk attached to each company (legal issues, new competitors, operational problems …), the risk of change in regulation and/or legislation, the geopolitical risk …
Nevertheless, we consider this subuniverse (as a whole) should be less volatile on the long run than our whole universe. It is important to notice that those stocks are usually perceived as high quality stocks by investors. So, they are usually trading at a premium relative to their theoretical fair value.
In order to detect those companies, we apply following criteria:
- We only want to keep companies with a volatility below the average volatility of our universe -> Sigma Volatility Level (SVL) <=2
- We only want to keep companies with good balance sheet and strong competitive position -> Sigma Corporate Rating (SCR) > A-
- We only want to keep companies which are not overvalued based on our valuation models -> Sigma Fundamental Rating (SFR) >= 3
- We only want to keep companies which are ‘neutral’ or ‘positive’ on a technical basis approach (based on their trend and momentum) -> Sigma Technical Score (STS) >=3
Then, the result of this screening is split in 2 subgroups: European stocks and US stocks.
Explanations of our different parameters:
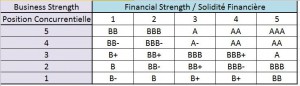
- The Sigma Corporate Rating (SCR) is a scoring scale we developed in order to attribute a corporate rating to each company. In order to do so, we analyse each company on two different aspects: their financial strength and their business strength. Based on different financial ratios and market data, we attribute a score from ‘1’ (weak) to ‘5’ (high) to the financial strength and the business strength. Thereafter, based on the matrix here below, we attribute the corporate rating.
- The Sigma Fundamental Rating (SFR) is a scoring scale we developed in order to make a link between the upside potential and the volatility level of a specific stock. So, a low volatility stock required less upside potential than a high volatility stock in order to justify a score of ‘4’ (attractive).
The scoring scale is determined as follow:
- SFR = ‘1’: the downside potential (based on our valuation models) is higher than -4 times the 50days price volatility expressed in percentage -> the stock is highly unattractive
- SFR = ’2’: the downside potential (based on our valuation models) is between -4 times and -2 times the 50days price volatility expressed in percentage -> the stock is unattractive
- SFR = ‘3’ : the estimated price change (based on our valuation models) is between -2 times and +2 times the 50days price volatility expressed in percentage -> the stock is neutral
- SFR = ‘4’ : the upside potential (based on our valuation models) is between +2 times and +4 times the 50days price volatility expressed in percentage -> the stock is attractive
- SFR = ‘5’ : the upside potential (based on our models) is greater than 4 times the 50days price volatility expressed in percentage -> the stock is highly attractive
- The Sigma Technical Score (STS) is a scoring scale we developed in order to score the trend and the momentum of a specific stock based on different time horizons (short term, medium term and long term).
The scoring scale is determined as follow:
- STS = ‘1’ : based on our algorithm dedicated to trend and momentum analysis, we consider the stock is highly unattractive
- STS = ‘2’ : based on our algorithm dedicated to trend and momentum analysis, we consider the stock is unattractive
- STS = ‘3’ : based on our algorithm dedicated to trend and momentum analysis, we consider the stock is neutral
- STS = ‘4’ : based on our algorithm dedicated to trend and momentum analysis, we consider the stock is attractive
- STS = ‘5’ : based on our algorithm dedicated to trend and momentum analysis, we consider the stock is highly attractive
- The Sigma Volatility Level (SVL) is a scoring scale we developed in order to estimate the volatility level of each stock within our investment universe.
- SVL = ‘1’ : the price volatility computed on the last 50 days is less than 50% of the average price volatility of our investment universe -> this stock was among the least volatile stock of our universe during the last 50 days.
- SVL = ‘2’ : the price volatility computed on the last 50 days is between 50% and 75% of the average price volatility of our investment universe -> this stock was less volatile than the rest of our investment universe.
- SVL = ‘3’ : the price volatility computed on the last 50 days is between 75% and 133% of the average price volatility of our investment universe -> this stock had a price volatility roughly in line with the price volatility of the rest of our universe.
- SVL = ‘4’ : the price volatility computed on the last 50 days is between 133% and 200% of the average price volatility of our investment universe -> this stock had a price volatility well above the average price volatility of the rest of our universe.
- SVL = ‘5’ : the price volatility computed on the last 50 days is greater than 2 times the average price volatility of our investment universe -> this stock was among the most volatile stock of our universe during the last 50 days.