![]()
In this section, we analyze the different sectors in order to rate them.
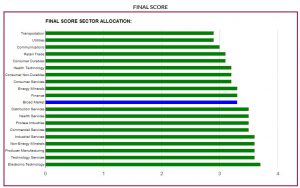
The first chart gives our final score on each sector. This score is computed by weighting the Sigma Technical Score at 55% and the Sigma Fundamental Rating at 45%. Each of those indicators is obtained by applying a market cap weighted approach on their different components (bottom up approach). Here again, we have the same scaling approach: a score of "1" means the sector is highly unattractive while a score of "5" means the sector is highly attractive. The charts of both the Sigma Fundamental Rating (SFR) and Sigma Technical Score (STS) have to be interpreted in the same way.
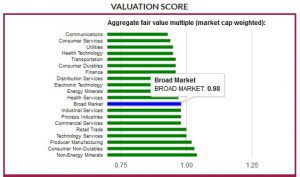
The chart of the fair value multiple has to be interpreted in a slightly different way. It gives (on a bottom up approach) the upside potential of each sector based on our models. In the chart below, we can notice the score of the "Broad Market" is at 0.98. So, this means there is a 2% upside, based on our models, for the broad market (the difference between 1 and 0.98).