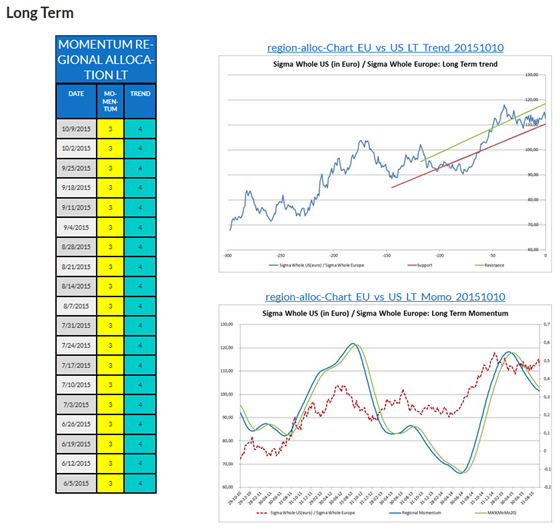
In this part we analyse the relative performance between Europe and USA in order to detect if it is better to invest in USA or in Europe. In order to do it, we compute the Sigma Whole US in euro and divide it by the Sigma Whole Europe (in euro).
Therefore, if the ratio rises, this means that USA are outperforming Europe while if the ratio declines this means that Europe is outperforming USA.
Thereafter, we analyse this ratio based on our technical algorithm which analyse both the momentum and the trend on different time horizons: long term, medium term and short term.
For each time horizon, we determine an ‘intermediate’ score for both the trend and the momentum:
- ‘1’ highly in favour of Europe vs USA
- ‘2’ in favor of Europe vs USA
- ‘3’ neutral
- ‘4’ in favor of USA vs Europe
- ‘5’ highly in favor of USA vs Europe
Those different scores are aggregated in order to generate a final score. This final score is expressed on the same scale than the intermediate scores (from 1 to 5):
- ‘1’ Europe is highly attractive relative to USA based on our algorithm
- ‘2’ Europe is attractive relative to USA based on our algorithm
- ‘3’ neutral
- ‘4’ USA is attractive relative to Europe based on our algorithm
- ‘5’ USA is highly attractive relative to Europe based on our algorithm
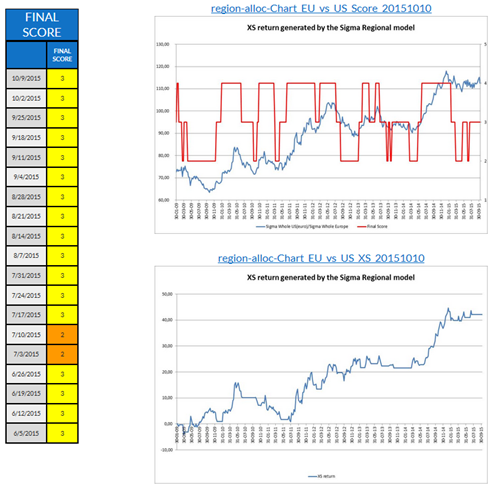
Explanations of first charts and table:
- The first table (called ‘Final score’) gives the regional final score
- The first chart draws both the regional ratio (in blue) and the regional final score (in red)
- The second chart draws the theoretical excess return that would have been generated by investing with this regional algorithm with following rules:
- A regional score at ‘1’ implies a double long on Europe (=> double short on USA)
- A regional score at ‘2’ implies a single long on Europe (=> single short on USA)
- A regional score at ‘3’ implies the model is neutral
- A regional score at ‘4’ implies a single long on USA (=> single short on Europe)
- A regional score at ‘5’ implies a double long on USA (=> double short on Europe)

