![]()
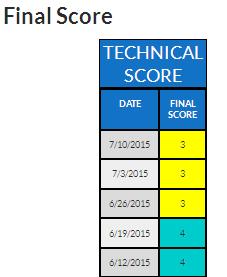
In this part, we analyze the technical situation of the equity market and we score it from 1 to 5:
- 1 = Highly Unattractive
- 2 = Unattractive
- 3 = Neutral
- 4 = Attractive
- 5 = Highly Attractive
This score is based on trend analysis and price momentum for different time horizons: short term, medium term and long term. For each period, we score both the trend and the price momentum from 1 to 5. Then we use a weighted average approach in order to compute the final score (70% for trend and 30% for price momentum).
Based on our own algorithm, we weight the different time horizons (short term, medium term and long term) in order to compute a final score. This final can be found in the first table.
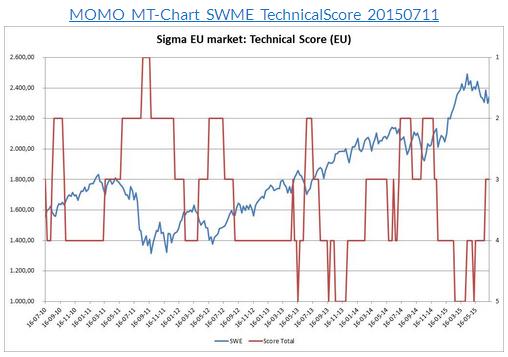
In the first chart, we draw the evolution of both our technical score (from 1 to 5) and the equity market.
In the second chart, we compute the theoretical gains that would have been generated by investing in the equity index based on our technical score. For sure, these are theoretical gains but they constitute a good proxy and track record for our technical score.
