![]()
It is always important to know what is currently priced in the equity market. Is it cheap or expensive relative to historical? In order to give a fair answer to this question, we analyze current valuation based on different metrics.
Why is it useful to look at valuation based on different metrics? Because markets are changing over time and investors are ready to pay different multiples if they are in the middle of an economic cycle or if the economy is right at the top of the cycle. It is also important to notice the economy changed a lot in the last 30 years: the economy is less cyclical and even cyclical sectors are experiencing less volatile margin during an economic cycle. Price/sales ratio is probably less relevant in a high margin environment….
So, in order to estimate current valuation, we use a basket of metrics which are:
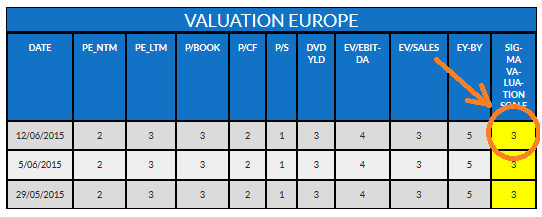
- PE_NTM = Price / next 12months estimated earnings
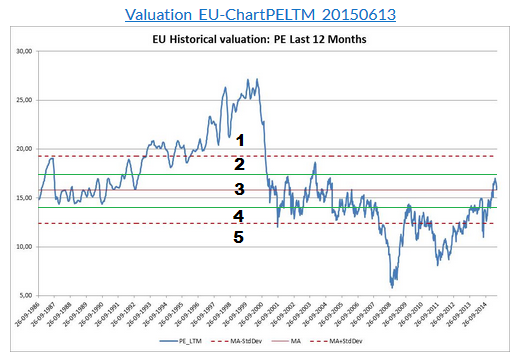
- PE_LTM = Price / last 12months reported earnings
- P/Book = Price / Book Value
- P/CF = Price / Cash Flow
- P/S = Price / Sales
- Dvd Yld = Current dividend Yield
- EV/EBITDA = Enterprise Value / EBITDA
- EV/Sales = Enterprise Value / Sales
- EY – BY = Earnings Yield / Bonds Yield = (1/PE) / Bonds Yield
What is our scoring approach?
Our scoring approach is rather simple. If current price is:
- Below historical average – 1 * standard deviation, it means the market is extremely attractive and we rate it at ‘5’.
- Between historical average – 1 * standard deviation and historical average – 0.5 * standard deviation, it means the market is attractive and we rate it at ‘4’.
- Between historical average – 0.5* * standard deviation and historical average + 0.5 * standard deviation, we consider the market is fairly valued and we rate it at ‘3’.
- Between historical average + 0.5 *standard deviation and historical average + 1 * standard deviation, we consider the market is rather expensive and we rate it at ‘2’.
- Above historical average + 1 * standard deviation, we consider the market is very expensive and we rate it at ‘1’.
2 exceptions: as a higher dividend yield is better for investors, we use an inverted scaling approach for the dividend yield and the spread between earnings yield and bonds yield.
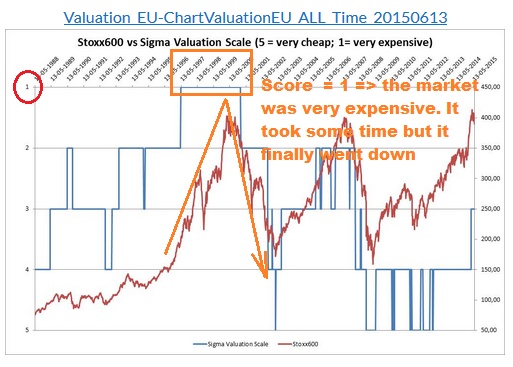
Then, we compute the average of different approach and we generate a global valuation score using the same scaling approach: 5 = very cheap; 3 = neutral; 1 = very expensive (based on historical standards)
It is important to notice that equity market can trade during long periods in expensive or cheap territory before normalizing the situation. So, it is very dangerous to only build an investment position on valuation basis. Nevertheless, on medium to long term, a cheap market will rerate and an expensive market will correct.
Very important remark:
In some specific case, an expensive market can become cheaper without any correction. How is it possible? If earnings are growing faster than equity prices then the market is getting cheaper.