08/07: Weekend review

The market consolidated at the beginning of the week but it was finally able to resume its uptrend on Wednesday. Even if the US non-farm payrolls were very strong and if they increase the risk of a more hawkish Fed in coming months, the market decided to focus on the number itself rather than on possible medium term implications. This underlines a positive mindset from investors: they decided to see the glass half-full rather than half-empty.

Economy:

Economic data continue to surprise to the upside in both the USA and Europe. This is positive for sentiment and this should allow economists and strategists to uplift their expectations for the economy. This should have a positive effect on price performance.


Valuation:

Following year to date decline in the European equity market, the European valuation score improved from '3' (neutral) to '4' (attractive). It remains at this level this week.

In the USA, the valuation score remains at '2' (unattractive): US equity market is printing new all-time highs while earnings estimates have been cut in recent months. So, valuation is rather stretched on this market.


Sentiment:

Bull-bear spread remains close to zero, there is no sign of euphoria or panic in the equity market. On top of that, with a neutral sentiment above 40%, we consider that market sentiment is not really relevant at this time (too much uncertainty in the market).


Technical analysis:

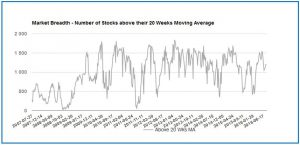
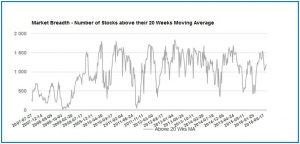
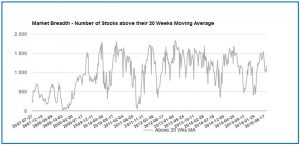
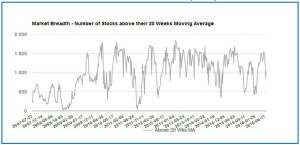
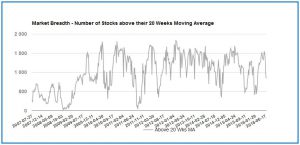
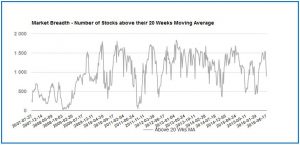
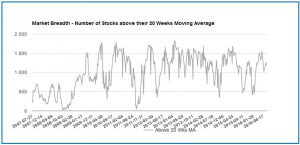
The number of companies trading above their 20weeks average slightly declined this week (grey curve). Even if it is difficult to draw any conclusion on this chart because current values are close to average historical levels, it is rather surprising that this metric deteriorated while the equity market looks so bullish.

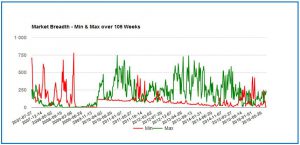
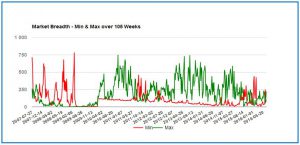
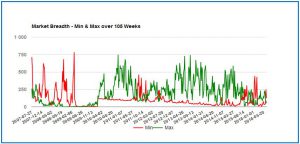
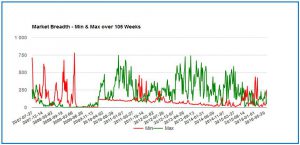
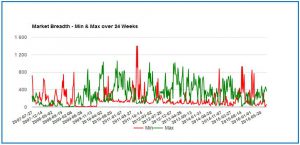
We can also notice on the second chart that the number of stocks printing new 6 months highs slightly decreased (green curve) while the number of stocks printing new 6 months lows slightly increased.

So, both charts are pointing in the same direction: even if the equity market seems highly bullish, its internal dynamic is currently deteriorating and this is a major warning we will have to monitor in coming weeks.


ab20wk20160807

24wk20160807

Following the post-Brexit rally in European equity market, the Sigma European technical score improved from '3' (neutral) to '4' (positive). It remains at this level this week.

In the USA, thanks to the strong performance of US equities, the Sigma US technical score has been unchanged at '4' (positive) for a couple of weeks.


Looking at the Sigma Whole Europe Index, we can notice this index sharply bounced back on a major horizontal support. On top of that, our intraday trend indicator (red curve on the second chart) reversed to the upside. So, it seems the short term positive scenario is the one to favor (on European equities) based on our indicators.


The Sigma Whole US Index resumed its uptrend and is, once again, printing new all-time highs. As we can clearly identify 5 sub-waves in current leg up started in late June, there is a meaningful probability that we are in the last phase of current rally. Looking at the chart of our intraday trend indicator (red curve on the second chart), we can notice this indicator also reversed in the USA. So, based on our indicators, the short term positive scenario is also the one to favor in the USA.


Conclusion:

It seems the consolidation is over. So, new all-time highs will probably be printed early next week in the USA while the European equity market should pursue its post Brexit rally. Nevertheless, with deterioration in internal market dynamic, stretched valuations in the US equity market, a nearly complete pattern in the wave structure and positive economic surprises, we fear the equity market is vulnerable to negative news. We keep our opinion that the equity market in both the USA and Europe will probably print a MAJOR TOP in the last 2 weeks of August.

08/02: Europe at risk, US looks tired

Following the release of the bank stress test on last Friday (after market close), the European market enjoyed a strong open on Monday. Nevertheless, some investors are not convinced by this stress test because it only covers 53 banks while other stress tests covered more than 100 banks. So, it seems this stress test could raise more questions than ease market fears on the health of the banking system.


Europe:

Some major European indexes printed an open gap on Monday. It is interesting to notice that this gap tested some major resistances. On top of that, as the European equity market hasn't been able to keep its daily gains and as it closed near its intraday low (in negative territory), there is a meaningful risk of market reversal. In order to confirm this bearish scenario, some supports need to be broken in coming sessions.


It is important to underline that our intraday trend indicator declined in negative territory (red curve). This is a warning signal for investors.


USA:

Even if the Nasdaq100 is in very good shape, it is not the case for all US indexes. We can notice that some major US indexes look rather tired at this stage (SP500, DJI, DJT). It is also important to notice that the DJ Industrials printed new all-time highs while the DJ Transport didn't confirm these tops. So, based on the Dow Theory, this could be a bearish sign (as long as the DJ Transport doesn't print new highs).


Conclusion:

The European equity market seems at risk but we need a confirmation in order to validate this bearish view. In the USA, even if the most tracked indexes are printing new highs day after day (SP500 & Nasdaq100), some other indexes look tired at this stage. So, the technical situation is deteriorating fast in both Europe and the USA.


07/31: Weekend review

While this week was a dangerous one for the equity market due to some major events (Fed meeting, BoJ meeting, earnings reports from some large cap US companies, ...), both the European and the US equity market was able to book nice gains.

Economy:

Economic surprises are picking up in both the USA and Europe. This is positive for sentiment and this should allow economists and strategists to uplift their expectations for the economy.


Valuation:

Following year to date decline in the European equity market, the European valuation score improved from '3' (neutral) to '4' (attractive). It remains at this level this week.

In the USA, the valuation score remains at '2' (unattractive): US equity market is printing new all-time highs while earnings estimates have been cut in recent months. So, valuation is rather stretched.

Sentiment:

Bull-bear spread remains close to zero, there is no sign of euphoria or panic in the equity market. On top of that, with a neutral sentiment close to 40%, we consider that market sentiment is not really relevant at this time (too much uncertainty in the market).


Technical analysis:

The number of companies trading above their 20weeks average is roughly unchanged this week (grey curve). It is difficult to draw any conclusion on this chart because current values are close to average historical levels. So, current situation can evolve in both directions.

We can also notice on the second chart that the number of stocks printing new 105weeks highs slightly increased (green curve) while the number of stocks printing new 105weeks lows is close zero.

So, there is no warning signal coming from those charts.

ab20wk20160731

105wk20160731

Following the post-Brexit rally in European equity market, the Sigma European technical score improved from '3' (neutral) to '4' (positive).

In the USA, thanks to the strong performance of US equities, the Sigma US technical score has been unchanged at '4' (positive) for a couple of weeks.


Looking at the Sigma Whole Europe Index, we can notice this index is close to some major resistances. On top of that, it seems the index lost some momentum in recent sessions. This situation can also be viewed (red line on the second chart) with our intraday trend indicator which is now close to zero.


The Sigma Whole US Index is printing new all-time highs week after week. The small consolidation we had in this index in the last 2 weeks could be viewed as a 4th wave but we are not convinced about this. It is interesting to notice that on the US equity market, our intraday trend indicator built a base and is now turning to the upside (in positive territory). So, this underlines a situation where we should expect another leg up in coming sessions.

Conclusion:

Economic data are coming above market expectations. This should lead to some positive revisions from economists and strategists which is good for equities. On a technical basis, both the European and the US equity markets are well oriented at this stage. Looking at valuation, Europe looks rather attractive while the US equity market is expensive. Nevertheless, as there is no sign of euphoria in the market at this stage, we consider it is probably too early to reduce the equity exposure and probably too late increase its equity exposure. A wait and see attitude is probably the best approach at this stage. Looking at the European equity market, we can notice that some sectors have been massive underperformers in recent months. So, those sectors could be attractive for medium investors (utilities, financials and materials).


7/29: No “real” measures from the BoJ

As we feared, market expectations for the Bank of Japan's (BoJ) meeting were quiet ambitious. Finally, what has been announced came well below market expectations and we are surprised that Asian markets are trading to the upside. It remains one major event for this week: the announcement of the results of the bank stress tests. Those results will be released after European market close which means that the US market will be the only one able to react this week.

CAC review:

The CAC remains close to some major resistances but after a 10%+ rally in July (erasing the Brexit selloff), we believe the CAC should take a breath in early Augustus in order to be able to move higher later in the month. We don't expect a major decline at this stage because current leg up doesn't look complete.


SP500 review:

The SP500 is stuck in a 20 points trading range (2156-2176) for more than 10days. This situation could underline a consolidation pattern (wave 4). So, if this is the right scenario, the SP500 could break this trading range and move to 2200 which looks like the obvious target area.


Conclusion:

After the strong rally we had in July (erasing the Brexit selloff), we would not be surprised to see some profit taking in early Augustus. We don't expect a market reversal at this stage but the market could print at the end of Augustus: with the pickup in economic activity as well as  the pickup in the (European) political activity in early September, some negative news flow could come back at the forefront of the debates.

07/24: Weekend review

This week was the less volatile one since the UK referendum: the ECB didn't announce any new monetary measure and the earnings season is roughly in line with expectations. So, the equity market is rather quiet. On the macro-economic front, we got some disappointing numbers in United Kingdom, telling us the Brexit has (already) some material consequences on the economy (PMI data were pointing to a sharp contraction). Nevertheless, it seems the market doesn't care at this stage.

Valuation:

Following year to date decline in the European equity market, the European valuation score improved from '3' (neutral) to '4' (attractive). In the USA, the valuation score remains at '2' (unattractive): US equity market is printing new all-time highs while earnings estimates have been cut in recent months. So, valuation is rather stretched.


Sentiment:

Bull-bear spread remains close to zero, there is no sign of euphoria or panic in the equity market. On top of that, with a neutral sentiment close to 40%, we consider that market sentiment is not really relevant at this time.


Technical analysis:

The number of companies trading above their 20weeks average is bouncing back (grey curve). It is difficult to draw any conclusion on this chart because current values are close to average historical levels. So, the situation can evolve in both directions.

We can also notice on the second chart that the number of stocks printing new 105weeks highs slightlyincreased (green curve) while the number of stocks printing new 105weeks lows is close to its 5years lows.

So, both charts are underlining the same situation; a homogenous ascending market.


20wk20160724

105wk20160724

Following the recent rally in the European equity market, the Sigma technical score improved from '3' (neutral) to '4' (positive).

In the USA, thanks to a strong resilience of equities, the Sigma technical score has been unchanged at '4' (positive) for a couple of weeks.


Looking at the Sigma Whole Europe Index, we can notice the index is right below a major horizontal resistance. It will be important to monitor if the market can rise above this level or if it fails.

The Sigma Whole US Index was able to clear the green resistance and is now printing new all-time highs day after day.  Last week small consolidation could be a 4th wave but we are not convince of this (maybe a sub 4 of III). Anyway, the pattern doesn't look complete at this stage, and we are ready for new highs in coming weeks.

Conclusion:

The US equity market remains biased to the upside and it should print new all-time highs in coming weeks. In Europe, the technical situation has been improving since the Brexit referendum. Even if valuation is not attractive at this stage, we don't consider it is the right time to sharply reduce the equity exposure because market sentiment is not extreme (there is no euphoria). Nevertheless, we don't consider the equity market is attractive at this time for medium and long term investors. So, a wait and see attitude is probably the best approach at this time.


07/17: Weekend review

The equity market enjoyed a strong week in both the USA and Europe; the European equitiy market pursued its bounce back (up ~=3.5% on the week) while the US equity market printed several new all-time highs.

Valuation:

Following year to date decline in the European equity market, the European valuation score improved from '3' (neutral) to '4' (attractive). In the USA, the valuation score remains at '2' (unattractive): US equity market is printing new all-time highs while earnings estimates have been cut in recent months. So, valuation is rather stretched.


Sentiment:

Bull-bear spread remains close to zero, there is no sign of euphoria or panic in the equity market. On top of that, with a neutral sentiment close to 40%, we consider that market sentiment is not relevant at this time.


Technical analysis:

The number of companies trading above their 20weeks average is bouncing back (grey curve). It is difficult to draw any conclusion on this chart because current values are close to average historical levels. So, the situation can evolve in both directions.

We can also notice on the second chart that the number of stocks printing new 105weeks highs slightly declined (green curve) while the number of stocks printing new 105weeks lows is close to its 5years lows (only 10 stocks).

So, both charts are underlining the same situation; a homogenous ascending market.


20wk20160717

105wk20160717

Following the strong bounce back in European equity market, the Sigma technical score improved from '3' (neutral) to '4' (positive).

In the USA, thanks a strong resilience of equities, the Sigma technical score has been unchanged at '4' (positive) for a couple of week.


Looking at the Sigma Whole Europe Index, we can notice the index is right below a major horizontal resistance. It will be important to monitor if the European equity market can move above this level.


The Sigma Whole US Index was able to move above the green horizontal resistance and printed several new all-time highs. We can clearly identify 3 subwaves in current rally. So, current rally is probably not over: we need 5 waves in order to complete an impulsive move.

Conclusion:

The equity market is biased to the upside and it should print new all-time highs in the USA in coming weeks. In Europe, the technical situation has been improving since the Brexit referendum. Even if valuation is not attractive at this stage, we don't consider it is the right time to sharply reduce equity exposure because market sentiment is not extreme (no euphoria). Nevertheless, we don't consider the equity market is attractive at this time for medium and long term investors. So, a wait and see attitude is probably the best approach at this time.

07/03: Weekend review

Following the post Brexit selloff, equity market is bouncing back in both the USA and Europe.

Valuation:

Following year to date decline in the European equity market, the European valuation score improved from '3' (neutral) to '4' (attractive). In the USA, the valuation score remains at '2' (unattractive): US equity market is close to its all-time highs while earnings estimates have sharply been reduced in recent months. So, valuations are rather stretched.


Sentiment:

Bull-bear spread is close to zero, there is no sign of euphoria or panic in the equity market. On top of that, with a neutral sentiment close to 40%, we consider that market sentiment is not relevant at this time.


Technical analysis:

The number of companies trading above their 20weeks average is bouncing back (grey curve). It is difficult to draw any conclusion on this chart because current values are close to average levels. So, the situation can evolve in both directions.

We can also notice on the second chart that the number of stocks printing new 105weeks highs is going up (green curve) while the number of stocks printing new 105weeks lows is going down.

So, both charts are underlining the same situation; a homogenous ascending market.


ab20wk20160702

105wk20160702

Following the sharp decline we had in Europe, the Sigma technical score moved back from '4' (attractive) to '3' (neutral).

In the USA, as the market remains very resilient to European turmoils, the Sigma technical score is unchanged at '4' (attractive).

Looking at the sigma Whole Europe Index, we can notice current bounce back is very steep. We can also notice the Sigma Whole Europe Index is now close to major horizontal resistances. It will be interesting to monitor if the market can move above this level or if it rolls back.

The Sigma Whole US index is, once again, close to its all-time highs. With the earnings season starting in 2 weeks, we will probably have a major catalyst in order to either print new historical highs or confirm the quadruple top scenario. The US non-farm payrolls next Friday could also act as a major catalyst on the equity market.

Conclusion:

Even if the market enjoyed a strong bounce back last week, we remain doubtful on current bounce back. We believe it is nearly impossible that the Brexit won't have any negative impact on European and Us economies. In this context, we are asking ourself what has been the real trigger for last week rally. Maybe a short squeeze, maybe some technical reasons linked to the end of the semester. Anyway, we believe the selling pressure should resume in coming sessions.


06/26: Weekend review

While the equity market started the week on a positive tone, the awakening was very rude for investors on Friday.

Valuation:

Following year to date decline in the European equity market, the European valuation score improved from '3' (neutral) to '4' (attractive). In the USA, the valuation score remains at '2' (unattractive): US equity market is close to its all-time highs while earnings estimates have sharply been reduced in recent months. So, valuations are rather stretched.


Sentiment:

The bull-bear spread is roughly unchanged this week (at -15%). Nevertheless, with a neutral sentiment above 40%, we consider the bull-bear spread is not relevant (because nearly one half of investors are neutral).


Last week we wrote: "It is also interesting to notice that the Sigma Smart Money Index Europe sharply declined in recent sessions. This underlines that 'strong hands' are reducing their exposure to the equity market."

This week, we can notice that 'strong hands' (blue curve) continue to reduce their equity exposure. This is a major warning for equity investors.

Technical analysis:

The number of companies trading above their 20weeks moving average continues to decline(grey curve).

We can also notice on the second chart that the number of stocks printing new 105weeks highs is going down (green curve) while the number of stocks printing new 105weeks lows is going up.

So, both charts are underlining the same situation; a homogenous declining market.


ab20wk20160626

105wk20160626


Following last weeks decline, the European technical score moved back to neutral (from attractive). In the USA, the technical score remains unchanged at '4' (attractive).


Looking at the Sigma Whole Europe Index, we can notice that Friday's selloff was highly impulsive. We can also notice that the Sigma Whole Europe printed 3 consecutive lower highs. This is not a bullish sign. We believe that February lows will be tested in coming weeks.

 
The Sigma Whole US Index is testing a major horizontal support. It will be important to monitor if the US equity market can remain above this level or if it breaches it. If the Sigma Whole US index declines below this support, the selling pressure should increase on US equities.

Conclusion:

The UK referendum was perceived as a bomb by equity investors. As this outcome was absolutely not anticipated by investors, we believe it will take a couple of sessions (and maybe weeks) to investors to price the uncertainty related to the Brexit outcome.

06/19: Weekend review

Fears related to the Brexit referendum  weight on equities performance in both Europe and the USA. For sure, the pressure is more present on the European equity market (which lost 2.5% this week) than on the US one (which lost 1.5% this week).

Valuation:

Following the year to date decline on the European equity market, its valuation score improved from '3' (neutral) to '4' (attractive). In the USA, the valuation score remains at '2' (unattractive): US equity market is close to its all-time highs while earnings estimates have sharply been reduced in recent months. So, valuations are rather demanding.


Sentiment:

Both the 'bull' and the 'neutral' sentiment declined this week. The bull bear spread sharply declined but as the 'neutral' sentiment remains pretty close to 40%, we can't consider current bull bear spread is relevant. So, we are still far from panic levels.


It is also interesting to notice that the Sigma Smart Money Index Europe sharply declined in recent sessions. This underlines that 'strong hands' are reducing their exposure to the equity market.


The situation is roughly the same in the USA than in Europe. So, even if US equity indexes look rather resilient at this time, we can also notice that 'strong hands' are reducing their exposure to the US equity market. So, the US equity market is not as resilient as it looks at first glance.


Technical analysis:

The number of companies trading above their 20weeks moving average (grey curve) sharply declined.

We can also notice on the second chart that the number of stocks printing new 105weeks highs is going down (green curve) while the number of stocks printing new 105weeks lows is going up.

So, both charts are underlining the same situation; a homogenous declining market.


ab20wk20160619

105wk20160619


Following last week decline, the Sigma Technical Score Europe declined from '4' (positive) to '3' (neutral). In the USA, the Sigma Technical score remains unchanged at '4' (positive).


Looking at the Sigma Whole Europe Index, we can clearly identify a 5 waves pattern in recent decline. On top of that, as the equity market reversed at the end of last week ,we can suppose the rally should continue early next week. The red horizontal resistance will probably be tested.


Looking at the Sigma Whole US Index, we can clearly notice that the market is stuck in a trading range limited by 2 horizontal line (the red one as support and the green one as resistance). If the market declines below its red horizontal support, this will be bearish for the equity market because this will confirm the quadruple top pattern.

Conclusion:

Even if the equity market initiated a bounce back at the end of last, it is obvious that medium term performance will only depend on UK's referendum. On top of that, we would like to underline that current situation is not in line with a major bottom in the equity market: investors' sentiment is not extreme, the number of stocks above their 20weeks moving average is far from its lows and 'strong hands' are damping their equity exposure. In this context, we consider the equity market is at risk of further correction after this short term bounce back.