04/09: Analyse du week-end

Après une semaine particulièrement attentiste, les marchés d'actions ont finalement été soulagés vendredi par des chiffres d'emploi relativement "mitigés". Ceci éloigne donc considérablement le risque d'une hausse de taux en septembre et nous dirige donc vers une seule hausse de taux en 2016 (tout comme en 2015). A ce rythme là, il risque de falloir quelques années avant que la Fed ne normalise sa politique monétaire. Il est également important de noter que l'indicateur ISM Manufacturing a été publié en dessous des attentes du marché à 49.6 (càd en dessous de la barre des 50 signalant la frontière entre expansion et contraction d'activité).

Economie:

Le niveau des surprises économiques continue de se détériorer tant aux USA qu'en Europe. Les deux courbes sont désormais proches de zéro, ce qui signifie donc que les économistes et les stratégistes pourraient commencer à réduire leurs attentes économiques. Ceci devrait donc entrainer des révisions à la baisse sur les attentes bénéficiaires des sociétés, ce qui devrait à son tour peser sur le marché des actions US et Européennes.


Valorisation:

Le marché Européen a vu son score de valorisation s'améliorer en passant de '3' (neutre) à '4' (attractif) suite à la forte baisse des actions européennes en ce début d'année. Son score de valorisation reste inchangé cette semaine.

Aux USA, le score de valorisation reste à '2' (inattractif). Il est vrai que le marché américain réalise de nouveaux sommets historiques semaine après semaine alors que les attentes bénéficiaires ont été considérablement revues à la baisse ces derniers mois. Les niveaux de valorisation sont donc tendus sur ce marché.


Sentiment:

L'écart entre le sentiment 'bull' et le sentiment 'bear' est désormais légèrement négatif, mais il n'y a aucun signe de sentiment extrême à ce jour. De plus, avec un sentiment 'neutre' restant proche des 40%, nous ne pouvons pas considérer que l'écart entre les bulls et les bears soit actuellement relevant car il y a beaucoup trop d'investisseurs 'neutres/sans opinion'.


Analyse Technique:

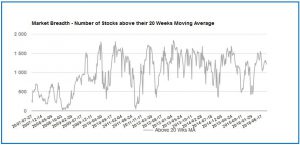
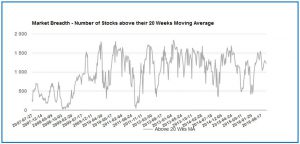
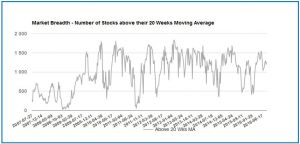
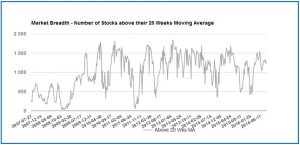
Le nombre de sociétés se traitant au-dessus de leur moyenne à 20 semaines (courbe grise) est relativement inchangé cette semaine. Bien qu'il soit difficile de tirer la moindre conclusion sur les niveaux actuels car la courbe se situe dans sa zone médiane et peut donc évoluer dans les deux sens (à la hausse ou à la baisse), la détérioration de cet indicateur ces dernières semaines montre tout de même une certaine forme de "fatigue" dans le marché.

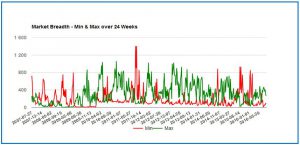
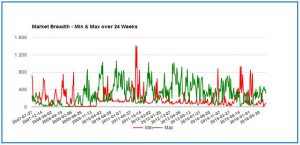
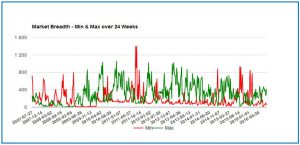
Nous pouvons constater sur le second graphique que le nombre de sociétés réalisant des nouveaux sommets à 6 mois (courbe verte) est en hausse cette semaine tandis que le nombre de sociétés réalisant des nouveaux plus bas à 6 mois (courbe rouge) est en baisse. Ceci montre donc une amélioration importante de la dynamique interne du marché

Sur base de ces deux graphiques, nous pouvons donc considérer que la dynamique interne des marchés s'est améliorée ces derniers jours. Ceci constitue donc un élément positif important sur le plan technique.


ab20wk20160902

24wk20160902

Suite au fort rebond des actions européennes depuis fin juin, le score technique du Sigma Whole Europe Index s'est amélioré en passant de '3' neutre à '4' attractif. Il reste à  ce niveau cette semaine.

Aux USA, la situation technique reste inchangée grâce à la bonne performance des indices, le score technique est à '4' (attractif).


Lorsque l'on analyse le Sigma Whole Europe Index, l'on constate que l'indice a fortement progressé en fin de semaine et semble casser une résistance horizontale importante. Si cette cassure est confirmée la semaine prochaine, le marché pourrait bien aller retester la résistance horizontale rose dans les prochaines semaines.


Avec deux retournements positifs mercredi et jeudi, le Sigma Whole US Index  montre, une fois de plus, qu'il ne veut pas baisser. De plus, avec la diminution du risque de hausse des taux à court terme suite aux chiffres mitigés de l'emploi américain, le marché américain semble avoir une raison de plus pour rester bien orienté. A ce stade, le trading range reste étroit, mais l'on devrait vrais semblablement assister à une cassure de ce range dès la semaine prochaine.


Conclusion:

Avec les surprises économiques qui se sont fortement détériorées ces dernières semaines et avec des statistiques majeures (ISM et payrolls) qui ont déçu la semaine dernière, la Fed a désormais une "bonne raison/excuse" pour ne pas augmenter ses taux en septembre. Il devient donc de plus en plus difficile d'envisager un catalyst baissier à court terme sur le marché.

09/01: Bearish reversal in Europe vs Bullish reversal in US

Uncertainty remains important and we will probably remain in this situation till we have more clarity on US interest rates. Yesterday, while the European market printed a bearish reversal (which is rather negative), the US market printed a bullish reversal (which is rather positive). This situation underlines that investors don't want to take medium term position at this stage, most of the trades are probably done on an intraday basis.

Europe:

While the start of the session was strong, the market sold off in the last hours of trading and closed in negative territory. This looks like a bearish reversal (which is negative) but it needs an impulsive move to the downside (by the end of the week) in order to be confirmed.


Looking at major European indexes, we continue to believe the short term consolidation is not over and we expect further downside in coming session as can be seen on the chart on the CAC.


USA:

While the Sigma Whole US Index was weak at the beginning of the session, it was able to rally in the last hours of trading and to close roughly flat.


Conclusion:

The market remains in a wait and see mood, it needs more clarity on the US interest rates cycle in order to break current trading range. US non-farm payrolls on Friday could be the catalyst but there is no certainty on this.


28/08: Analyse du week-end

Cela fait plusieurs semaines que nous attendions le sommet de Jackson Hole, et il s'est tenu ce week-end. Que pouvons-nous tirer comme conclusion? J.Yellen et S.Fischer, à savoir les numéros 1 et 2 de la Fed, on fait tout ce qu'ils pouvaient pour convaincre le marché que une hausse de taux, et probablement deux, étaient dans les cartons d'ici la fin de l'année car "l'économie et le marché de l'emploi se sont considérablement améliorés ces derniers mois". Quelles sont les implications? Au vu de la réaction des marchés, je doute que le discours ait été pris de manière crédible. Il semble que le marché ait plutôt réagit comme dans une partie de poker où l'on sait très bien que le partenaire bluff systématiquement et n'a rien dans son jeu. Par conséquent, J.Yellen et S.Fischer se sont mis tout seul dans une position très inconfortable où soit ils remontent les taux en septembre de manière à regagner de la crédibilité soit ils ne font rien, et ils perdent les derniers soupçons de crédibilité qu'ils avaient dans le marché. Ce choix est probablement difficile à faire car les marchés ne mettent pas une probabilité élevée sur une hausse de taux en septembre, et un tel mouvement induirait un probable choc dans le marché. Il semble donc que le marché ait entamé un bras de fer entre lui et la Fed et je suis très dubitatif à ce stade sur le "gagnant" de la partie.

Economie:

Le niveau des surprises économiques s'est nettement détérioré aux USA (courbe bleue), il est désormais proche de zéro. Ceci signifie donc que le nombre de révisions positives de la part des économistes et des stratégistes devrait diminuer dans les prochaines semaines. En Europe, les surprises positives ont légèrement baissé (courbe rouge) mais dans une moindre mesure qu'aux USA. Si cette situation devait se poursuivre dans les semaines à  venir, les marchés perdraient un support fondamental important. En effet, des surprises positives mènent à des révisions positives et supportent des cours à la hausse tandis que des surprises négatives mènent à la situation inverse.


Valorisation:

Le marché Européen a vu son score de valorisation s'améliorer en passant de '3' (neutre) à '4' (attractif) suite à la forte baisse des actions européennes en ce début d'année. Son score de valorisation reste inchangé cette semaine.

Aux USA, le score de valorisation reste à '2' (inattractif). Il est vrai que le marché américain réalise de nouveaux sommets historiques semaine après semaine alors que les attentes bénéficiaires ont été considérablement revues à la baisse ces derniers mois. Les niveaux de valorisation sont donc tendus sur ce marché.


Sentiment:

L'écart entre le sentiment 'bull' et le sentiment 'bear' reste relativement équilibré, il n'y a aucun signe de sentiment extrême à ce jour. De plus, avec un sentiment 'neutre' restant proche des 40%, nous ne pouvons pas considérer que l'écart entre les bulls et les bears soit actuellement relevant car il y a beaucoup trop d'investisseurs 'neutres/sans opinion'.


Analyse Technique:

Le nombre de sociétés se traitant au-dessus de leur moyenne à 20 semaines (courbe grise) continue de baisser. Bien qu'il soit difficile de tirer la moindre conclusion sur les niveaux actuels car la courbe se situe dans sa zone médiane et peut donc évoluer dans les deux sens (à la hausse ou à la baisse), la détérioration de cet indicateur constitue un signe important de détérioration de la dynamique interne du marché.

De même, nous pouvons constater sur le second graphique que le nombre de sociétés réalisant des nouveaux sommets à 6 mois (courbe verte) est en baisse ces dernières semaines tandis que le nombre de sociétés réalisant des nouveaux plus bas à 6 mois (courbe rouge) est en hausse. Une fois encore, ceci met en évidence une détérioration de la dynamique interne des marchés.

Cela fait donc quatre semaines que ces deux graphiques mettent en évidence une détérioration de la dynamique interne des marchés. Il ne peut donc pas s'agir d'une situation temporaire liée à des prises de bénéfice. Cette détérioration est donc bien réelle.


ab20wk20160828

24wk20160828


Suite au fort rebond des actions européennes depuis fin juin, le score technique du Sigma Whole Europe Index s'est amélioré en passant de '3' neutre à '4' attractif. Il reste à  ce niveau cette semaine.

Aux USA, la situation technique reste inchangée grâce à la bonne performance des indices, le score technique est à '4' (attractif).


Lorsque l'on analyse le Sigma Whole Europe Index, l'on constate que l'indice a fortement progressé en 5 sous-vagues depuis son rebond de fin juin. Après avoir buté sur une résistance majeure il y a 2 semaines, le marché a entamé un mouvement de repli. A ce stade, le repli se fait sans impulsivité. Ceci plaide donc en faveur d'une consolidation dans la hausse plutôt qu'en faveur d'un retournement majeur de marché. Notre indicateur de tendance intra-journalière reste en territoire négatif et évolue à la baisse, on pourrait donc assister à une poursuite de la baisse/consolidation la semaine prochaine.


Le Sigma Whole US Index  montre de plus en plus de difficultés à progresser et l'on peut aisément subdiviser la hausse depuis fin juin en 5 sous-vagues claires. De plus, notre indicateur de tendance intra-journalière (courbe rouge sur second graphique) reste orienté à la baisse et est passé en territoire négatif. La consolidation pourrait donc se poursuivre dans les prochaines séances aux USA.

Conclusion:

La Fed semble s'orienter dans un bras de fer avec le marché en vue de restaurer sa crédibilité. La Fed parlant d’une hausse de taux, voire de deux hausses de taux d'ici la fin de l'année, elle s'est mise dans une situation où une hausse de taux en septembre devient inéluctable afin de confirmer ces déclarations. Cependant, le marché n'anticipant pas du tout un tel mouvement, cela induirait un probable choc dans le marché. La Fed va-t-elle aller contre le marché en vue de restaurer sa crédibilité fortement écornée depuis 12 mois? Ses dirigeants semblent dire que oui, mais le marché en doute fortement. Il faudra attendre la réunion de la Fed de septembre afin d'avoir la réponse. En attendant, le climat d'incertitude risque de se prolonger. Attention, des bons chiffres de l'emploi vendredi prochain pourraient mettre le feu aux poudres...


08/24: Waiting for Jackson Hole

The volatility has been declining for a couple of weeks and it is now at very low level, it seems obvious that investors are waiting for Jackson Hole's symposium. Can we imagine that J.Yellen will become 'hawkish'? Looking at what she did in the last 18months, it is difficult to imagine J.Yellen becoming "hawkish" but some investors and strategists believe she will.

Europe:

The Sigma Whole Europe Index is close to a major support but current consolidation doesn't look over because we don't have a clean "abc" at this stage. So, the consolidation could continue till Friday and J.Yellen will decide what happens next week.


Looking at the CAC and the DAX, we consider that 4250-4300 (for the CAC) and 10200 (for the DAX) could be the next targets for this consolidation.


USA:

The Sigma Whole US Index remains close to its all-time highs and there is no sign of reversal at this stage. Nevertheless, we can notice some signs of distribution on the Sigma Smart Money Index US (blue curve on the second chart). This could be the early sign that strong hands are taking some money out of the market.


Conclusion:

The equity market is waiting for J.Hole's symposium and it is difficult to bet on the outcome. J.Yellen has always been very dovish, and we don't see any reason why she could turn hawkish. The only one we can imagine would be that she starts to be afraid to build a major bubble in the equity market. Does she really care about this? We will have the answer by Sunday.


08/21: Weekend review

After a multi-week rally, the European equity market came (finally) under pressure this week. In the USA, the equity market was roughly unchanged on the week. It seems the Jackson Hole’s symposium brings some kind of nervousness among investors.

Economy:

Economic surprises came down in the US and are now close to zero. This means that (positive) economic revisions from economists and strategists will slow in coming weeks. So, US equity market will lose a major driver. In Europe, economic surprises came also down but this was less important than in the USA.  Nevertheless, the implications will be the same than in the USA:  economists and strategists won't uplift their estimates and the market will lose a tailwind.


Valuation:

Following year to date decline in the European equity market, the European valuation score improved from '3' (neutral) to '4' (attractive). It remains at this level this week.

In the USA, the valuation score remains at '2' (unattractive): US equity market is printing new all-time highs week after week while earnings estimates have been cut in recent months. So, valuation is rather stretched on this market.


Sentiment:

Bull-bear spread remains close to zero, there is no sign of euphoria or panic in the equity market. On top of that, with a neutral sentiment close to 40%, we consider that market sentiment is not really relevant at this time (too much uncertainty in the market).


Technical analysis:

The number of companies trading above their 20weeks average has been declining for 3 weeks (grey curve). Even if it is difficult to draw any conclusion on this chart because current values are close to average historical levels, it is rather surprising that this metric deteriorated while the equity market remains well oriented. This underlines a clear deterioration in the internal dynamic of the equity market.

We can also notice on the second chart that the number of stocks printing new 6 months highs has deteriorated in recent weeks (green curve) while the number of stocks printing new 6 months lows has increased.

So, both charts are pointing in the same direction: the internal dynamic is currently deteriorating and this is a major warning we have to monitor.


20wk20160819

24wk20160819

Following the post-Brexit rally in European equity market, the Sigma European technical score improved from '3' (neutral) to '4' (positive). It remains at this level this week.

In the USA, thanks to the strong performance of US equities, the Sigma US technical score has been unchanged at '4' (positive) for a couple of weeks.


Looking at the Sigma Whole Europe Index, we can clearly identify a 5sub-waves pattern in the rally which started in late June. The market hit a major resistance last week and was unable to break it. The pullback we had this week was the first meaningful decline since late June but as there is no negative impulsivity in current decline, it is difficult to talk about a major market reversal. Current decline looks more like a consolidation (in an uptrend) rather than the early stage of a medium term downtrend. Our intraday trend indicator remains in negative territory but reversed to the upside on Friday. So, we could have a market rebound early next week.


The Sigma Whole US Index remains very well oriented but the market has only been able to grab a few points in the last weeks. We can clearly indentify a 5 sub-waves pattern in the late June rally and with our intraday trend indicator (red curve on the second chart) in negative territory, the risk of further consolidation is important.


Conclusion:

There is a couple of weeks we are calling for a major top in the second part of August. At this stage, there is no sign that a medium term top is in place because there is no negative impulse in the markt. So, current action looks like a consolidation in an uptrend rather than the strart of a medium term downtrend. Nevetheless, with a meaningful deterioration in the internal dynamic of the equity market and economic surprises rolling down, there are some good reasons to be cautious on current situation. Don't forget the Jackson Hole's symposium will take place next week-en. It will probably be a major catalyst for the equity market in early September.

08/17: First signs of market reversal

Both the European and the US equity markets gapped down today. This is a major warning that the equity market is at risk of a market reversal.

Europe:

The Sigma Whole Europe Index hasn't been able to break its major horizontal resistance. It will be important to monitor if current actions is a "soft consolidation" (leading to higher price next week) or the negative impulsivity starts to pick up.


We can also notice that our intraday trend indicator continues to decline and is now close to negative territory. If it moves in negative territory, this will sharply increase the probability of a trend reversal.

USA:

We also had a pullback in the US equity market. It is also important to notice the recent decline in the DJ Utilities which is usually consider as a proxy bonds. So, if it declines, this means that investors start to reconsider the rate hike probability. So, on a relative basis, this index becomes less attractive and it declines.

Our intraday trend indicator remains well oriented at this stage. It will be important to monitor if it remains in positive territory or if it rolls down in coming sessions.


Conclusion:

Both the US and the European equity markets showed some signs of weakness. It will be important to monitor if this weakness is followed some negative impulsivity. If it is the case, this will be a major warning for the equity market (major risk of trend reversal).

08/14: Weekend review

After a very strong start of the week, both the European and the US equity market took a breath in the second part of the week and they lost most of their positive momentum. We believe the equity market will now shift its focus on Jackson Hole's symposium (27th -> 29th of August).

Economy:

Economic data continue to surprise to the upside in both the USA and Europe. This is positive for sentiment and this should allow economists and strategists to uplift their expectations for the economy. This should have a positive effect on price performance.


Valuation:

Following year to date decline in the European equity market, the European valuation score improved from '3' (neutral) to '4' (attractive). It remains at this level this week.

In the USA, the valuation score remains at '2' (unattractive): US equity market is printing new all-time highs week after week while earnings estimates have been cut in recent months. So, valuation is rather stretched on this market.


Sentiment:

Bull-bear spread remains close to zero, there is no sign of euphoria or panic in the equity market. On top of that, with a neutral sentiment above 40%, we consider that market sentiment is not really relevant at this time (too much uncertainty in the market).


Technical analysis:

The number of companies trading above their 20weeks average slightly declined the last 2 weeks (grey curve). Even if it is difficult to draw any conclusion on this chart because current values are close to average historical levels, it is rather surprising that this metric deteriorated while the equity market looks so bullish.

We can also notice on the second chart that the number of stocks printing new 6 months highs slightly decreased the last 2 weeks (green curve) while the number of stocks printing new 6 months lows slightly increased.

So, both charts are pointing in the same direction: even if the equity market seems highly bullish, its internal dynamic is currently deteriorating and this is a major warning we will have to monitor in coming weeks.

20wk20160813

24wk20160813

Following the post-Brexit rally in European equity market, the Sigma European technical score improved from '3' (neutral) to '4' (positive). It remains at this level this week.

In the USA, thanks to the strong performance of US equities, the Sigma US technical score has been unchanged at '4' (positive) for a couple of weeks.


Looking at the Sigma Whole Europe Index, we can notice this index enjoyed a strong rally since late June. This index is now close to major horizontal resistance and with its intraday momentum which is fading (red curve on the second chart), we believe this index should pull back in coming sessions.


The Sigma Whole US Index remains very well oriented but the market has only been able to grab a few points in the last sessions. We can clearly indentify a 5 sub-waves pattern in the late June rally and with our intraday trend indicator (red curve on the second chart) turning south, the risk of consolidation is important.


Conclusion:

There is a couple of weeks that we anticipate a major top in the equity market in the second part of August. J.Yellen's speech in end August at Jackson Hole will probably be the trigger for a major move in the equity market. Indeed, either J.Yellen's speech is hawkish and the market will have to reprice interest rate expectations and the equity market should correct or J.Yellen's speech is dovish (data dependent, ...) and then the market will feel very comfortable with current expectation of no rate hike before June 2017 (10 months from now). In this case, I would not be surprised to see a huge rally in the equity market like in October 1999. Can the Fed take the responsibility of a huge market bubble like in 1999-2000? J.Yellen is the only one to know the answer. In my case, I would prefer to avoid a market bubble leading to a market crash in coming years.

08/12: We believe we are close to a top

The equity market continues to climb and even if sentiment data are pointing to high uncertainty (with neutral sentiment above 40% in AAII survey), it becomes difficult to consider there is no kind of euphoria in current rally. Indeed, after 8years of rising equity markets, pending Brexit negotiations, the Fed getting closer and closer to the point where it will have to normalize interest rates and the US Presidential calendar (usually the first year in US Presidential cycle is a bad one for equities), it is difficult to consider we are not close to the end of current cycle. On top of that, if you take into consideration current multiples expansion in the US equity market, it seems there are tons of good reasons to fear current market action.

Europe:

Following Thursday's rally, most European indexes are now close or pretty close to major horizontal resistances. For sure the market can move above these levels, but we consider it should be normal to take a breath after the huge rally we had this summer.


USA:

More and more US indexes are reaching new all-time highs. Yesterday, the Nasdaq joined the party, thanks Janet for this great event...


Conclusion:

It seems a certain kind of euphoria is building in the market and J.Yellen's speech in end August at Jackson Hole will probably be the trigger for a major move in the equity market. Indeed, either J.Yellen's speech is hawkish and the market will have to reprice interest rate expectations and the equity market should correct or J.Yellen's speech is dovish (data dependent, ...) and then the market will feel very comfortable with current expectation of no rate hike before June 2017 (10 months from now). In this case, I would not be surprised to see a huge rally in the equity market like in October 1999. Can the Fed take the responsibility of a huge market bubble like in 1999-2000? J.Yellen is the only one to know the answer. In my case, I would prefer to avoid a market bubble leading to a market crash in coming years.

08/10: Current wave structure looks complete

There is a couple of weeks we are expecting a MAJOR TOP in the equity market during the second half of August. Now, looking at the 2 latest trading sessions in both the US and Europe, we can notice some kind of nervosity picking up. Coming days could be critical for current rally (the one started in late June).

Europe:

The Sigma Whole Europe Index is back at pre-Brexit levels. The wave structure of current rally looks complete with 5 sub-waves. On top of that, the structure of the 5th sub-wave looks also complete which means we could have a market reversal anytime soon. Of course, the rally could also continue during a couple of days. The CAC is in the same situation than the Sigma Whole Europe Index while the DAX has already cleared its pre-Brexit top.


Looking at our daily trend indicator, the Sigma Trend Index(STI) we can notice it is actually at '54'. So, it is well above the key '34' level which underlines the risk of a bearish reversal. An impulsive decline in coming sessions would sharply increase this major risk.


STI20160810

Looking at our intraday trend indicator (red curve on the chart), there is no reversal at this stage. This indicator will be the one to track in coming sessions.


USA:

The Sigma Whole US Index is in a better situation than the Sigma Whole Europe Index but we can also identify a 5 waves structure starting at the end of June. On top of that, it seems this index is currently struggling to grab any point and as it reversed yesterday, this situation is clearly not improving. The Nasdaq 100 was very close to beat its 2000 all-time high (at 4817) on Tuesday but it hasn't been able to do it. As it reversed later in the session, Tuesday's candle looks rather worrying (reversed hammer). So, it seems the US equity market is also loosing its positive momentum.


Our intraday trend indicator didn't reverse at this stage. So, there is no imminent risk coming from this indicator.


Conclusion:

The wave structure of the rally which started at the end of June looks complete (5 clean waves) and we have some indication that the US and the European equity market is losing some momentum. So, it seems the rally is now at risk and coming sessions could set a major turning point in the equity market.

08/09: The rally is probably not over

Both the European and the US equity market had a consolidation session on Monday. Nevertheless, based on our indicators, we expect the rally will resume soon: we don't believe a market

Europe:

The Sigma Whole Europe Index has not been able to rise above last week's levels. But we don't believe the 5th wave is already over because our intraday trend indicator remains well oriented (red curve on the second chart).


Even if we admit that the intraday reversal we had in Europe on Monday is not a bullish sign, we keep our short term positive view.

USA:

Even if the Sigma Whole US Index printed new all-time highs at market open, it has not been able to confirm these levels on close. The S&P500 was in the same situation.


Warning: most US indexes are well oriented but the DJ Utilites is losing some momentum. This could be explained by the fact that investors are increasing the probability of a short term Fed rate hike in the US (sooner than anticipated before). In this scenario, high yield stocks would become less attractive (relative to risk free interest rates).

Conclusion:

Even if Monday's session was not impressive, we keep our short term positive view for the equity market. We still believe a major top should be reached in the second part of August.